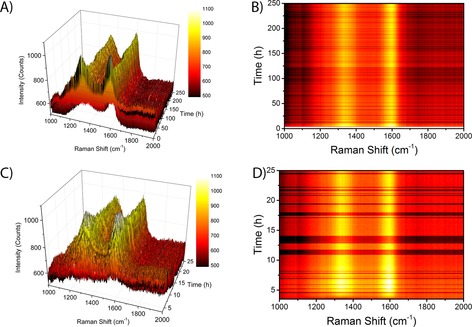
Figure 7.

Operando Raman spectroscopy of a 15 wt % Co/TiO2 FTS catalyst during FTS at atmospheric pressure and 250 °C. A) 3 D plot of the Raman spectra as a function of time during the first 250 h of FTS reaction. B) Contour plot of the Raman spectra during the first 250 h of FTS reaction, using the same color map as in A). C) 3D plot of the Raman spectra as a function of time during the first 25 h of FTS reaction. D) Contour plot of the Raman spectra during the first 25 h of FTS reaction, using the same color map as C).
