
Figure 5.
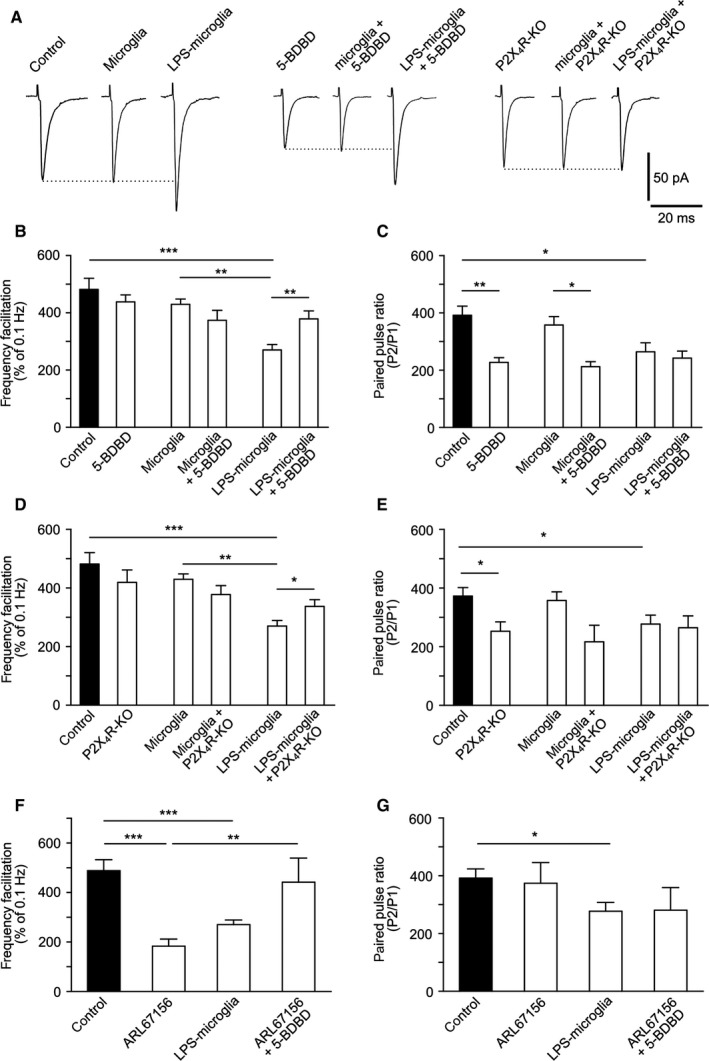
LPS‐microglia‐derived ATP regulates FF via P2X4Rs. (A) Representative traces of EPSCs triggered at low frequency of stimulation (0.1 Hz). (B) Graphical representation of FF. Blockade of P2X4Rs by 5‐BDBD (10 μm) inhibited the effect of LPS‐microglia on FF (control, 482 ± 39%; 5‐BDBD, 438 ± 25%; microglia, 430 ± 18%; microglia + 5‐BDBD, 374 ± 35%; LPS‐microglia, 281 ± 18%; LPS‐microglia + 5‐BDBD, 378 ± 28%; n = 9 for all conditions). (C) Graphical representation of the PPR. 5‐BDBD (10 μm) had no effect on the decrease in the PPR induced by LPS‐microglia, whereas it reduced it when applied alone (control, 392 ± 32%; 5‐BDBD, 227 ± 16%; microglia, 357 ± 35%; microglia + 5‐BDBD, 212 ± 18%; LPS‐microglia, 277 ± 31%; LPS‐microglia + 5‐BDBD, 242 ± 25%; n = 9 for all conditions). (D) Bar representation of FF. Genetic deletion of P2X4R (P2X4R KO) abolished the LPS‐microglia induced decrease in FF (control, 482 ± 39%; P2X4R KO, 419 ± 43%; microglia, 430 ± 18%; microglia + P2X4R KO, 377 ± 31%; LPS‐microglia, 281 ± 18%; LPS‐microglia + P2X4R KO, 337 ± 23%; n = 9 for all conditions). (E) Graphical representation of the PPR. The LPS‐microglia‐induced decrease in the PPR was preserved in P2X4R KO slices (control, 392 ± 32%; P2X4R KO, 253 ± 32%; microglia, 357 ± 35%; microglia + P2X4R KO, 216 ± 57%; LPS‐microglia, 277 ± 31%; LPS‐microglia + P2X4R KO, 265 ± 41%; n = 9 for all conditions). (F) Graphical representation of FF. Addition of ARL67156 (10 μm) mimicked the LPS‐microglia‐induced decrease in FF, whereas prior blockade of P2X4Rs by 5‐BDBD (10 μm) prevented this effect (control, 482 ± 39%, n = 9; ARL67156, 183 ± 29%, n = 3; LPS‐microglia, 281 ± 18%, n = 9; ARL67156 + 5‐BDBD, 442 ± 97%, n = 3). (G) Graphical representation of the PPR. Increasing the level of endogenous ATP with ARL67156 (10 μm) had no effect on the PPR (control, 392 ± 32%, n = 9; ARL67156, 324 ± 71%, n = 3; LPS‐microglia, 277 ± 31%, n = 9; ARL67156 + 5‐BDBD, 281 ± 78%, n = 3). Values in all graphs are mean ± SEM. *P < 0.05, **P < 0.01 and ***P < 0.001 from one‐way anova followed by a Newmann–Keuls multiple comparison test.