
Figure 6.
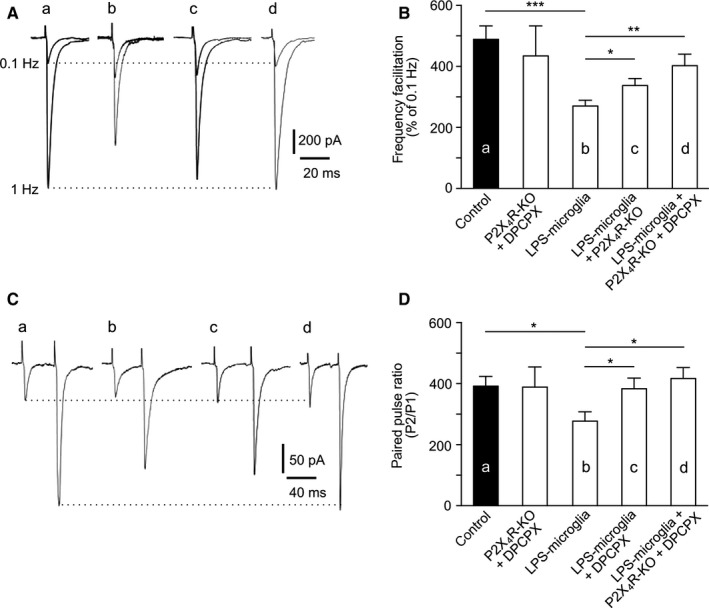
ATP and adenosine act independently on P2X4Rs and A1Rs. (A) Representative traces of EPSCs recorded at 0.1 Hz and 1 Hz, illustrating FF in different conditions. (a) Control. (b) LPS‐microglia. (c) LPS‐microglia + P2X4R KO. (d) LPS‐microglia + P2X4R KO + DPCPX. (B) Graphical representation of FF. Blockade of A1R by DPCPX (100 nm) had no effect on the inhibitory effect of P2X4R KO on the LPS‐microglia‐induced change in FF (control, 482 ± 39%, n = 9; P2X4R KO + DPCPX, 434 ± 98%, n = 5; LPS‐microglia, 281 ± 18%, n = 9; LPS‐microglia + P2X4R KO, 337 ± 23%, n = 9; LPS‐microglia + P2X4R KO + DPCPX, 402 ± 38%, n = 5). (C) Representative traces of EPSCs recorded at 0.1 Hz, illustrating the PPR in different conditions. (a) Control. (b) LPS‐microglia. (c) LPS‐microglia + DPCPX. (d) LPS‐microglia + P2X4R KO + DPCPX. (D) Graphical representation of the PPR. Genetic deletion of P2X4Rs had no effect on the DPCPX‐induced inhibition of the LPS‐microglia‐induced decrease in the PPR (control, 392 ± 32%, n = 9; P2X4R KO + DPCPX, 388 ± 66%, n = 5; LPS‐microglia, 277 ± 31%, n = 9; LPS‐microglia + DPCPX, 383 ± 35%, n = 9; LPS‐microglia + P2X4R KO + DPCPX, 417 ± 36%, n = 5). Values in all graphs are mean ± SEM. *P < 0.05, **P < 0.01 and ***P < 0.001 from one‐way anova followed by a Neumann–Keuls multiple comparison test.