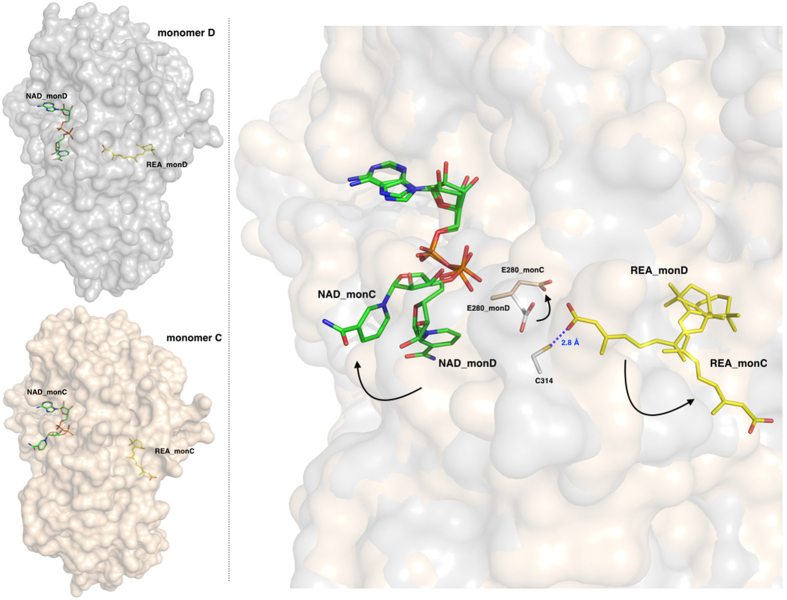
Figure 3. The two different and coupled conformations adopted by REA and NAD+.
Left-hand side: surface representation of monomers D (upper, in grey) and C (lower, in light-pink) with bound NAD+ and REA shown as green and yellow sticks, respectively. Right-hand side: a zoom-in showing the REA and NAD+ conformations as observed in monomers D and C, shown with a surface representation in the background, after optimal superposition; the catalytic C314 from monomer D is depicted as grey stick and the E280 is shown in the two conformations adopted in monomer D and C. The two conformations observed for REA and NAD+ are coupled as indicated by the arrows, one couple representing the closed state (in monomer D) and the open state (in monomer C) that represents the product-release conformation. The residue E280 also oscillates between two conformations following those observed for the ligands.

