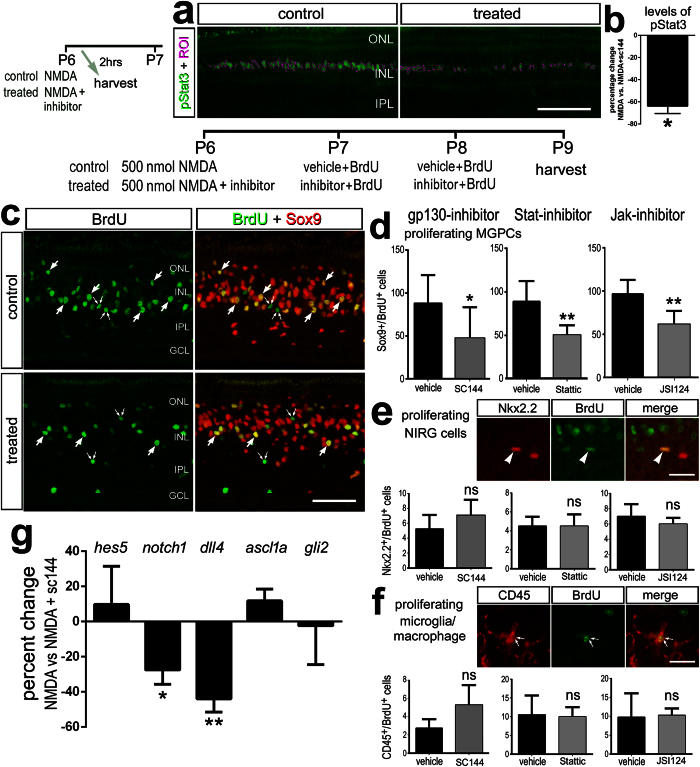
Figure 2. The formation of proliferating MGPCs is suppressed by inhibition of Jak/Stat signaling.
Eyes were injected with 500 nmol NMDA ± inhibitor at P6, BrdU ± inhibitor at P7 and P8, and retinas harvested at P9. Sections of the retinas were labeled with antibodies to pStat3 (green); (a), and BrdU (green) and Sox9 (red); (c), and Nkx2.2 (red) and BrdU (green); (e) and CD45 (red) and BrdU (green); (f). Panel a includes regions of pixels or ROIs (regions of interest) above threshold outlined in magenta. The histogram in (b) illustrates the percent change in density sum for pStat3 (SD; n = 4) in the nuclei of Müller glia treated with NMDA versus NMDA+ sc144. Arrows indicate BrdU+/Sox9+ MGPCs, and small double-arrows indicate BrdU+/Sox9− microglia. The scale bar in panel c represents 50 μm and in panels (e,f) 10 μm. Histograms illustrate the mean (±SD) numbers of proliferating MGPCs (d), NIRG cells (e), and microglia/macrophages (f). Mean numbers of proliferating cells in retinas (±SD; n ≥ 6) treated with NMDA + vehicle (control) and NMDA + gp130 inhibitor (sc144) (c), Stat-inhibitor (stattic), or Jak-inhibitor (JSI124). (g) qRT-PCR was used to measure genes that are changed in response to the gp130-inhibitor sc144 in NMDA-damaged retinas. These genes included hes5, notch1, dll4, ascl1a, and gli2. Abbreviations: ONL – outer nuclear layer, INL – inner nuclear layer, IPL – inner plexiform layer, GCL – ganglion cell layer, ROI – regions of interest.

