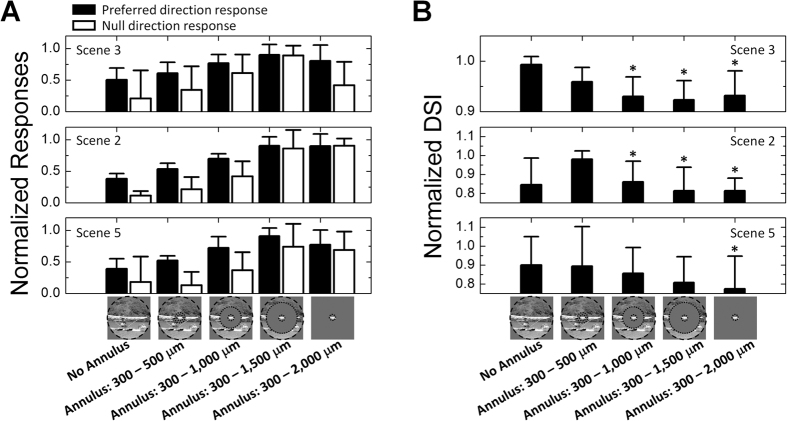
Figure 4. Natural viewing maximizes index of directionality.
(A) Average responses (n = 5) to motion Scenes (3, 2 and 5) as a function of annulus size. Annuli shown in Fig. 3A were used to mask increasing portions of the surround. Filled and unfilled bars indicate responses to preferred and null direction responses, respectively. Each individual response was normalized by the maximum for that scene across all 12 orientations for that cell. Preferred and null responses were normalized independently of each other. (B) Average directional selectivity index (DSI) as a function of annulus size (n = 5). Within each plot, all DSIs were normalized to the maximum value for that scene. Error bars, SD. Paired one tailed student’s t-test was applied to verify the significance of statistical comparisons; *P < 0.05. T-test was performed between each column with the column showing biggest average of DSIs. The movie frame shown at the bottom of bar charts is from ‘CORAL REEF ADVENTURE’ © MacGillivray Freeman Films. Used by permission. All rights reserved. This figure is not covered by the CC BY license.

