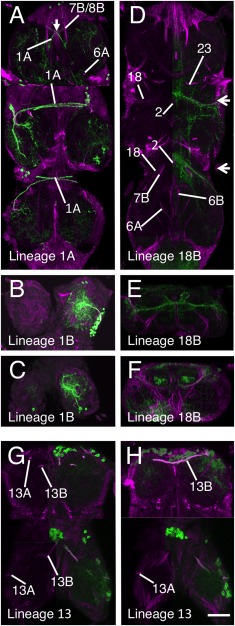
Figure 3.

Validation of the hemilineage tract identification for the lineages that contribute to the anterior commissures. Each panel is a composite of five horizontal Z stacks to best illustrate the identification. Where possible, the left side of the image has the GFP signal (green) removed to allow identification of the underlying neuroglian signal (magenta). (A–C) Lineage 1 revealed by immortalization of the larval expression pattern of line R22G11. (A) Hemilineage 1A. (B,C) Hemilineage 1B tract in T1 (B) and T2 (C). (D–F) Hemilineage 18B revealed by immortalization of the larval expression pattern of line R27A09. (D) Hemilineage 18B projections in T2 and T3. (E,F) Transverse sections E (T2) and F (T3) at the levels indicated by the arrows in D. (G,H) Lineage 13 revealed by immortalization of the larval expression pattern of line R81F02 in T1 and T2 only. Scale bar = 100 μm.
