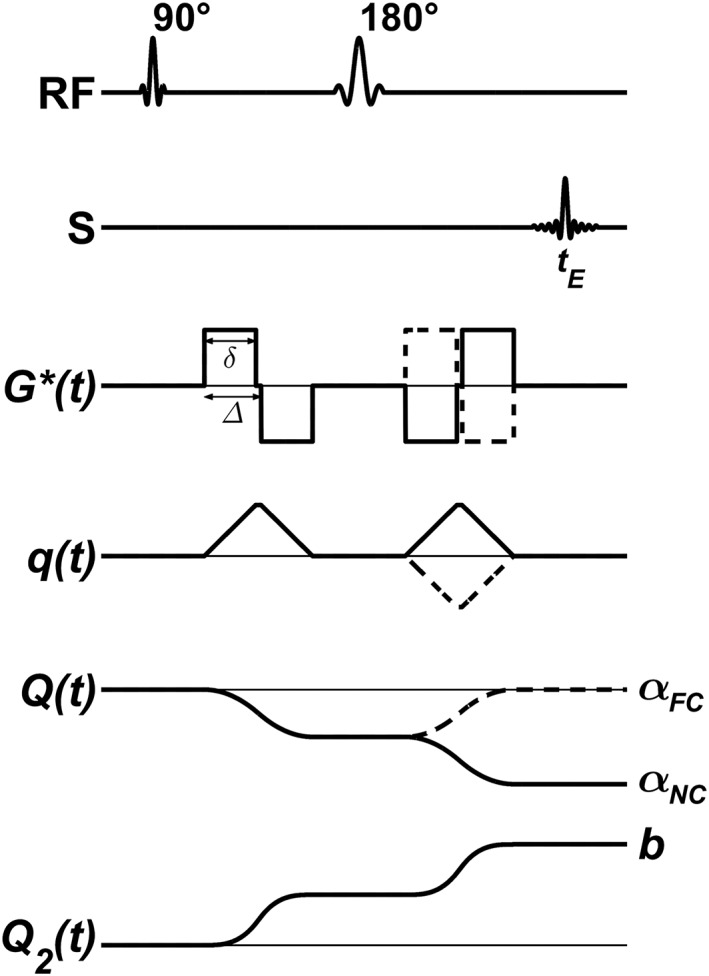
Figure 1.

Schematic overview of the NC and FC DDE sequences. RF shows the excitation and refocusing pulses, S displays the acquired spin echo, G*(t) is the magnetic field gradient waveform of the sequence, q(t) is the dephasing factor (Equation (3)), Q(t) corresponds to the negative integral of q from zero to t, where Q(tE) = α (Equation (5)), and Q2(t) is the integral of q 2 from zero to t, where Q2(tE) = b (Equation (2)). Solid lines correspond to the NC acquisition, and dashed lines to the FC acquisition (i.e., α = 0). Note the resemblance of the FC and NC acquisitions, resulting in identical timings and diffusion weightings b, but different flow weightings αNC/FC.
