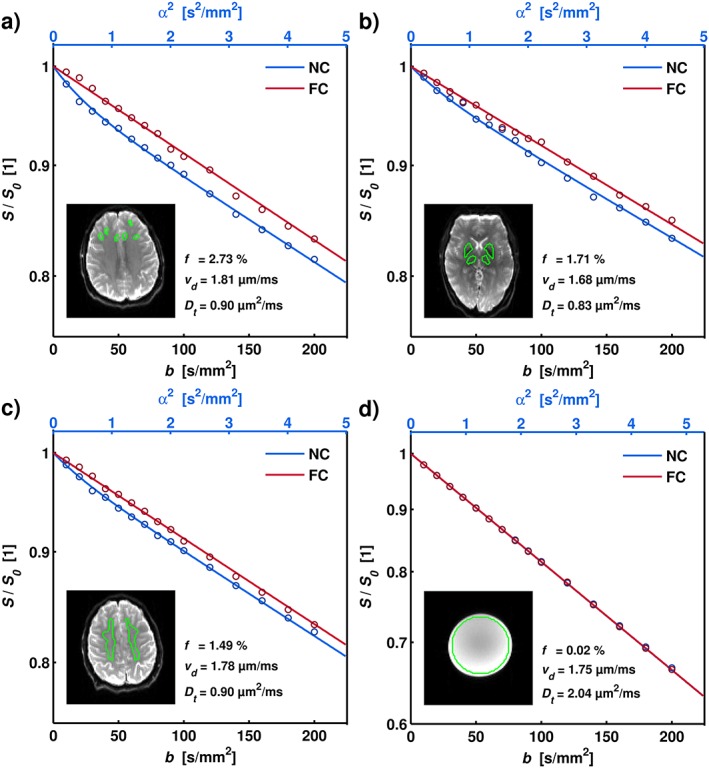
Figure 2.

Examples of experimental data and analysis for ROIs corresponding to frontal GM (a), DGM (b), and WM (c), as well as for the stationary water phantom (d). The GM ROIs were drawn to minimize CSF partial volume effects. The insets show the corresponding S0 images, with the ROIs indicated in green. The graph shows the mean ROI signal (circles) and the corresponding model fit (solid lines) as a function of diffusion and flow weighting. Note the significant rephasing effect in the FC data. The estimated parameters were the following: (a) f = 2.73 [2.33–3.02]%, vd = 1.81 [1.65–1.94] μm/ms, D t = 0.90 [0.86–0.98] μm2/ms; (b) f = 1.71 [1.23–2.09]%, vd = 1.68 [1.61–1.91] μm/ms, D t = 0.83 [0.75–0.93] μm2/ms; (c) f = 1.49 [1.25–1.69]%, vd = 1.78 [1.69–1.86] μm/ms, D t = 0.90 [0.86–0.96] μm2/ms; (d) f = 0.02 [0–0.03]%, vd = 1.75 [1.73–1.78] μm/ms, D t = 2.04 [2.02–2.07] μm2/ms. Brackets indicate 95% confidence intervals obtained using residual bootstrapping.
