Figure 3.

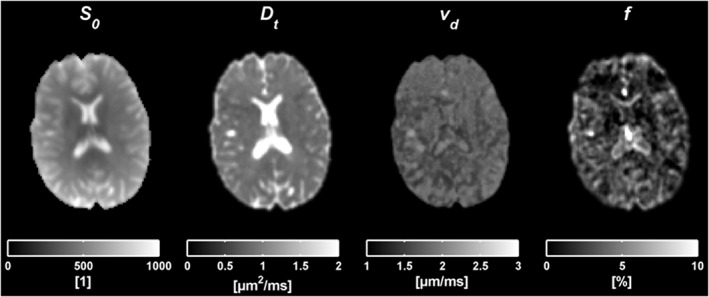
Results from the voxel‐by‐voxel analysis taken from one slice in one subject. The figures from left to right correspond to parametric maps of S0, D t, vd and f.

Results from the voxel‐by‐voxel analysis taken from one slice in one subject. The figures from left to right correspond to parametric maps of S0, D t, vd and f.