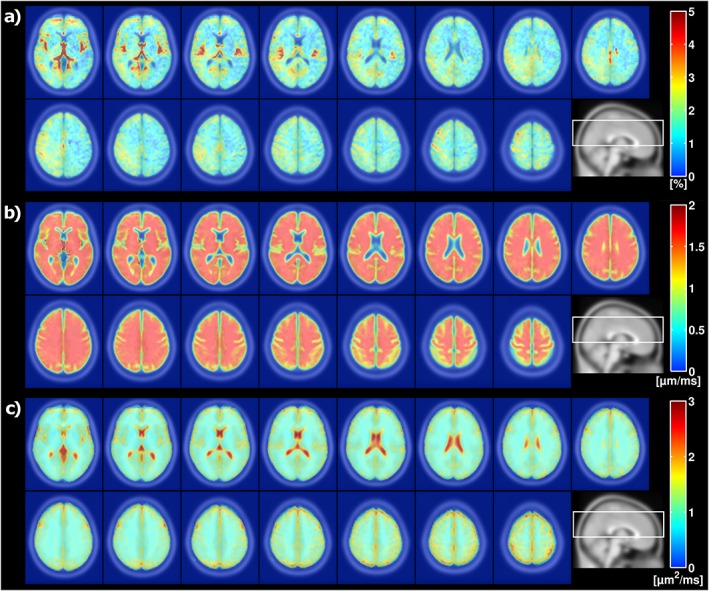
Figure 4.

Mean (a) perfusion fraction f, (b) velocity dispersion vd, and (c) diffusion coefficient D t, in 15 MNI slices across all eight subjects. CSF is masked out in the f and vd maps using the MNI tissue probability information in SPM12. The positioning of the slices, indicated on a sagittal image, is shown at the bottom right of the respective sub‐images.
