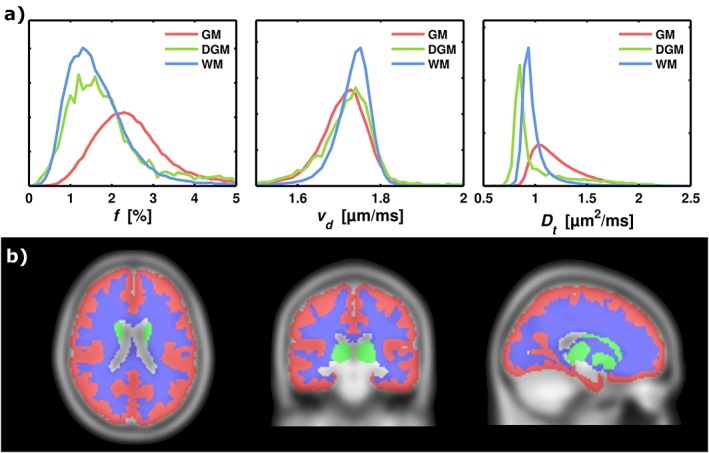
Figure 5.

Histogram analysis of the model parameters in the GM, DGM, and WM MNI ROIs. (a) The columns show histograms of f, vd, and D t. (b) The MNI template in three projections, with the applied ROIs: GM, DGM, and WM. The color‐encoding corresponds to the histogram curves. The histograms are normalized to unity, so that the y axes correspond to relative frequency.
