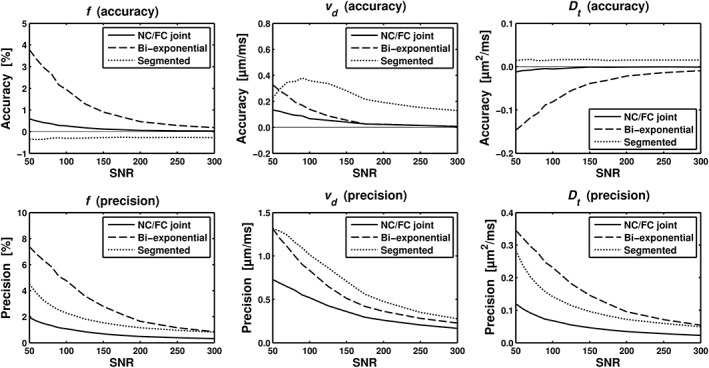
Figure 7.

Simulation results comparing accuracy and precision of perfusion parameters estimated with the joint analysis (‘FC/NC joint’) and two different conventional IVIM analysis approaches, i.e., bi‐exponential fit (‘Bi‐exponential’) and segmented fit (‘Segmented’). Graphs show accuracy (top row) and precision (bottom row) for f, vd and D t (columns from left to right) as a function of SNR. Simulated parameter values were f = 5%, vd = 1.75 μm/ms, and D t = 0.8 μm2/ms.
