Figure 6.

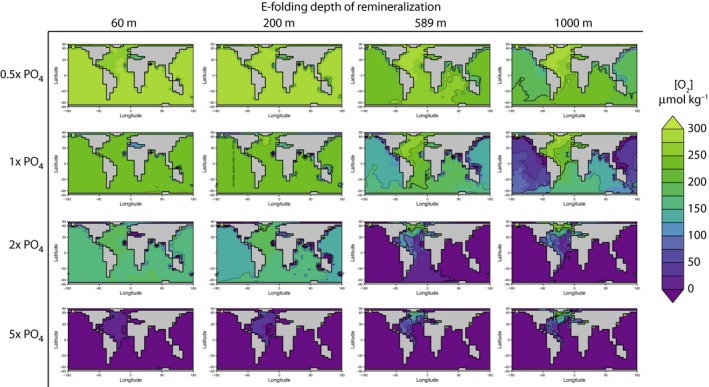
Matrix of model results illustrating the distribution of oxygen in μmol kg−1 in the deep ocean. Maps are arranged according to specified phosphate inventory and remineralization depth.

Matrix of model results illustrating the distribution of oxygen in μmol kg−1 in the deep ocean. Maps are arranged according to specified phosphate inventory and remineralization depth.