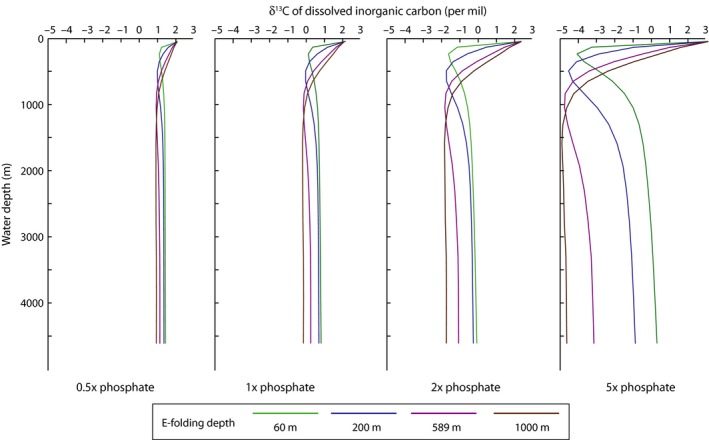
Figure 8.

Profiles of δ13 CDIC vs. depth for model simulations at 0.5 × to 5 × modern phosphate (arranged left to right). Similar to the trends in oxygen, the remineralization depth controls the position of the δ13C minimum, and the phosphate concentration controls the magnitude of the vertical δ13C gradient.
