
Figure 3. geNorm analysis of qPCR-based candidate reference genes.
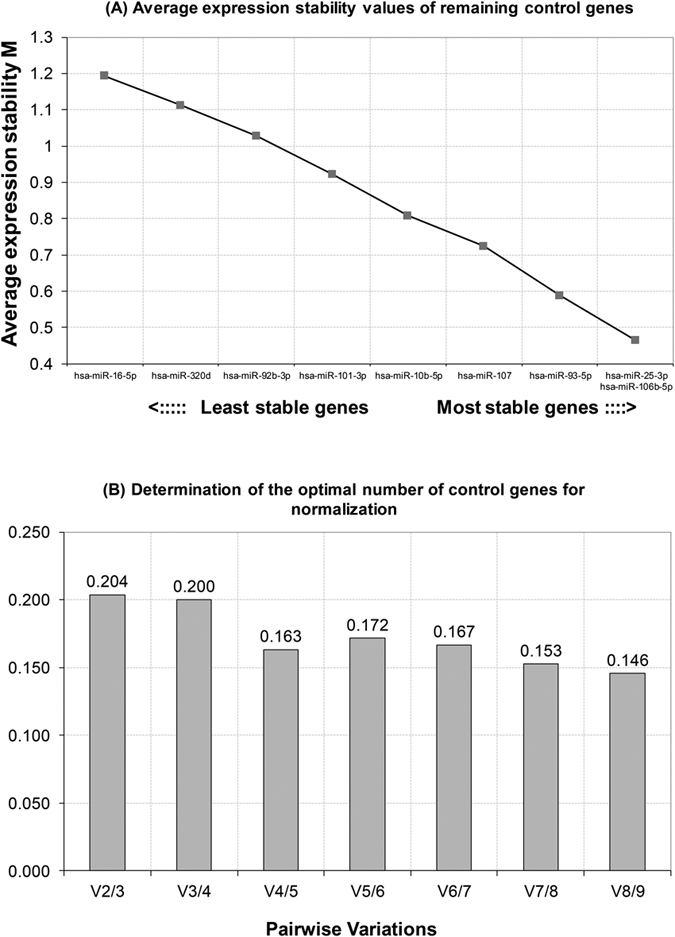
(A) Average expression stability values of remaining control genes. M was excluded in a stepwise manner until the two most stable genes remained: hsa-miR-25-3p and hsa-miR-106-5p. (B) Determination of the optimal number of control genes for normalization. The number of reference genes is considered optimal when the V value reached the lowest, at which point it is unnecessary to include additional genes in the normalization strategy.