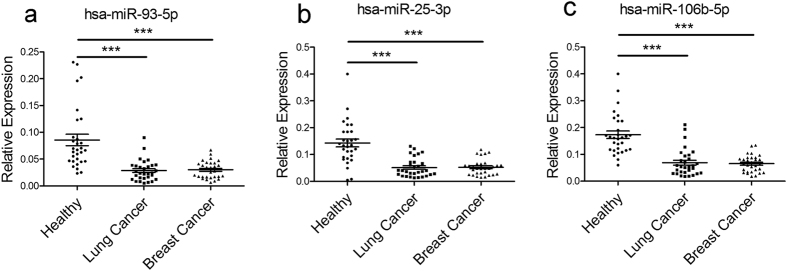
Figure 5. Expression levels of hsa-miR-93-5p, hsa-miR-25-3p and hsa-miR-106b-5p in non-small cell lung cancer and breast cancer.
miRNAs were quantified in the plasma of 30 non-small cell lung cancer patients, 30 breast cancer patients and 30 healthy individuals. miRNA levels were normalized to spiked-in cel-miR-54-5p and represented in scatter plots. Data are shown as means ± SE, **P < 0.01, ***P < 0.001.

