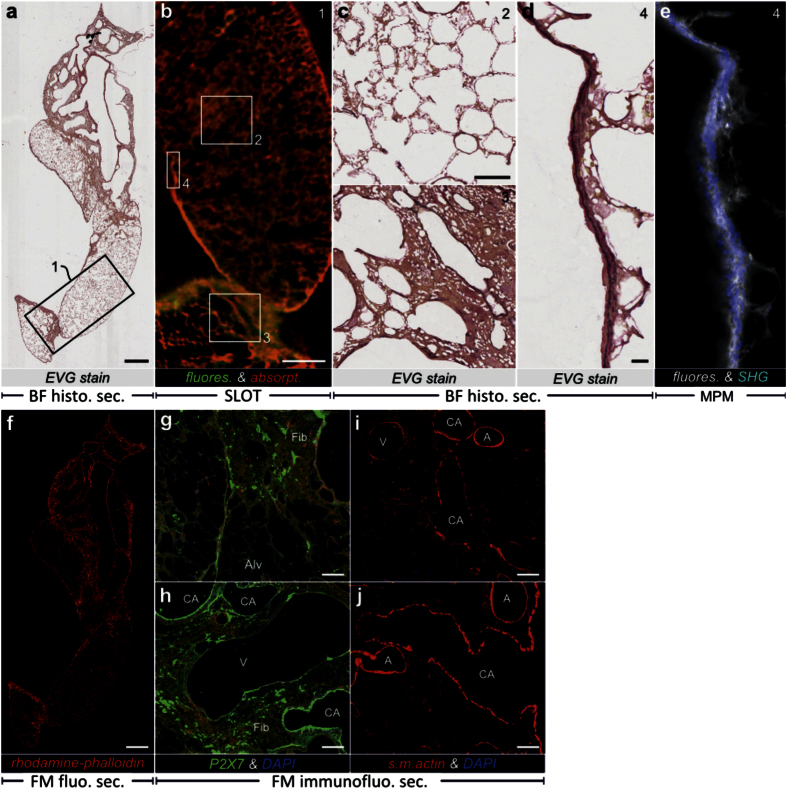
Figure 4. Histological and fluorescent sections of the CRISTAL sample in correlation with SLOT and MPM.
(a) Bright field (BF) microscopy analysis of section from fibrotic rat lung stained with Elastica van Gieson (EVG) after MPM measurements demonstrating elastic fibers in the accessory lobe. (b) Corresponding reslice through SLOT 3D data showing correlation with fluorescence and absorption channel at the boxed region in a. (c) Enlarged views from a indicated by the squared boxes in b demonstrate differences between fibrotic (ROI 3) and non-fibrotic (ROI 2) tissue at subcellular resolution level. (d) Enlarged view showing the pleura region from the small box in b that corresponds to the fiber structures in the SHG signal from (f). (e) By correlating it with the corresponding MPM slice visualizing fluorescence and SHG in the CRISTAL sample, the origin of the SHG signal in (f) can be traced back to collagen fibers. (f) Fluorescence Microscopy (FM) detection of F-actin fibers in a CRISTAL section of a fibrotic rat lung lobe using rhodamine-phalloidin (red). (g,h) Immunofluorescence (IF) of the purinergic receptor P2X7 reveals intense staining of discrete regions within fibrotic remodeling areas as well as bronchial epithelia (green). (i,j) IF of smooth muscle actin in walls of conducting airways, blood vessels and individual cells in the fibrotic remodeled tissue as well as parenchyma (red). (Conducting airways (CA), veins (V), arteries (A), alveoli (Alv), fibrotic remodeling (Fib)). Scale bars, 1 mm (a,f), 500 μm (b), 100 μm (c,g–j), 20 μm (d,f).

