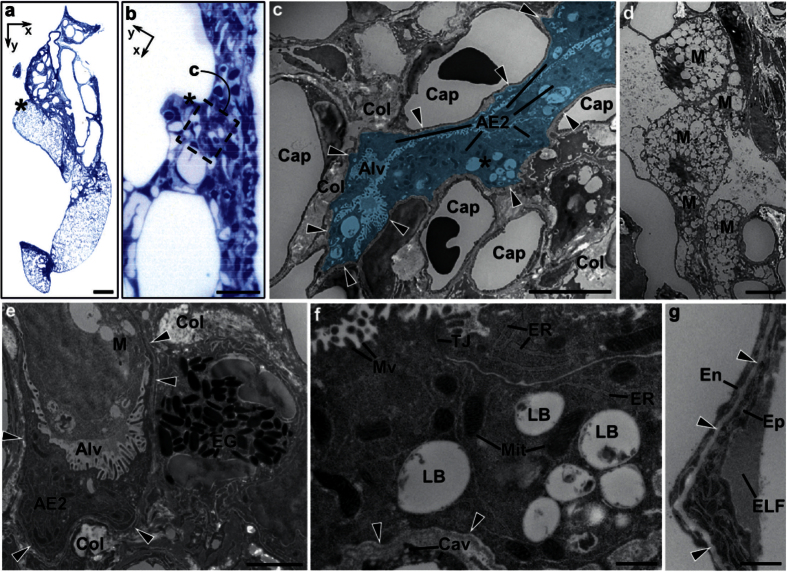
Figure 5. Correlative TEM analysis of SLOT selected areas in bleomycin-treated lung.
(a) Histological section with Toluidine blue staining of targeted area in the lung. The TEM analyzed area is marked with asterisk and shown in a closer look (b) within a TEM correlation. (c) Electron microscopy image (area of b, box with asterisk) of lung parenchyma showing capillaries (Cap) and collapsed alveolus (Alv), highlighted in blue, with accumulation of alveolar epithelial type II cells (AE2). The alveolar epithelial basal lamina can be traced (arrow heads). Large depositions of collagen fibrils (Col) are visible. (d) Alveolus with several macrophages (M). (e) Detail of eosinophil granulocyte (EG), collagen depositions (Col), and collapsed alveolus (Alv) with alveolar epithelial basal lamina (arrow heads), alveolar epithelial type II cell (AE2) and macrophage (M). (f) High magnification of alveolar epithelial type II cell (area of c, asterisk). Subcellular details like ribosomes, endoplasmic reticulum (ER), mitochondria with cristae (Mit), apical microvilli (Mv), tight junction (TJ) and lamellar bodies (LB, lamella mostly extracted) are visible. On the vascular side of epithelial basal lamina (arrow heads), the caveolae (Cav) of the endothelial cell can be identified. (g) Blood-air barrier with endothelium (En), basal lamina (arrow heads) and epithelium (Ep) with protein-rich epithelial lining fluid (ELF). Scale bars, 1 mm (a), 10 μm (b), 5 μm (c,d), 2 μm (e), 0.5 μm (f,g).

