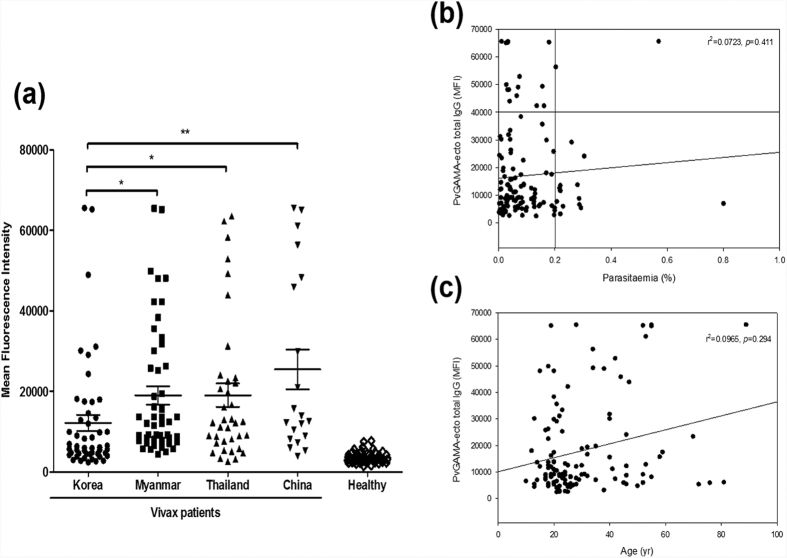
Figure 3. Natural acquired antibodies against the PvGAMA-Ecto antigen.
(a) Total IgG prevalence of PvGAMA-Ecto with the P. vivax patient and healthy individual sera samples. The bar indicates the mean ± standard error of the fluorescence intensity. The p-values were calculated using Student’s t-test. (b) The correlation between PvGAMA-Ecto with parasitaemia was evaluated using Spearman’s correlation test. An MFI >40,000 was considered high intensity and parasitaemia >0.2% was considered high parasitaemia. (c) The correlation between PvGAMA-Ecto and parasitaemia was evaluated using Spearman’s correlation test. MFI, mean fluorescence intensity.

