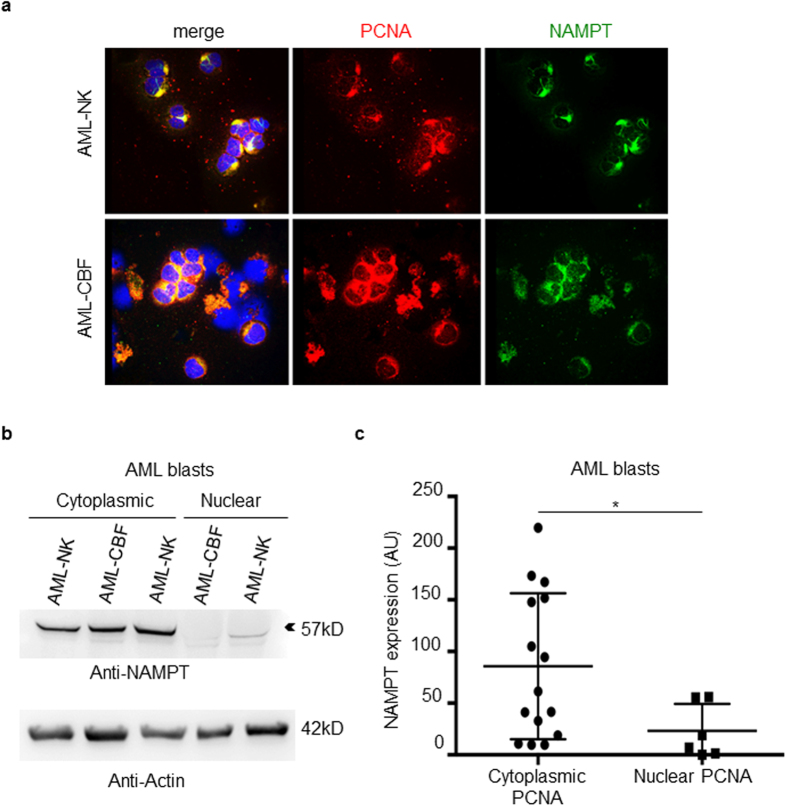
Figure 7. Analysis of NAMPT expression in blast from AML patients.
(a) Colocalization between NAMPT (green) and PCNA (red) in blasts cells of AML patients after immunofluorescence labeling. This panel shows a representative experiment of three yielding the same results. (b) Western blot analysis of NAMPT expression in the cytosol of blasts from AML patient including three patients with cytoplasmic PCNA localization and two patients. (c) Results were quantified by densitometry and normalized to β-actin loading control for 15 AML patients with cytoplasmic PCNA versus 6 AML patients with nuclear PCNA. The data are mean ± SEM, *p < 0.05 (Mann-Whitney test).

