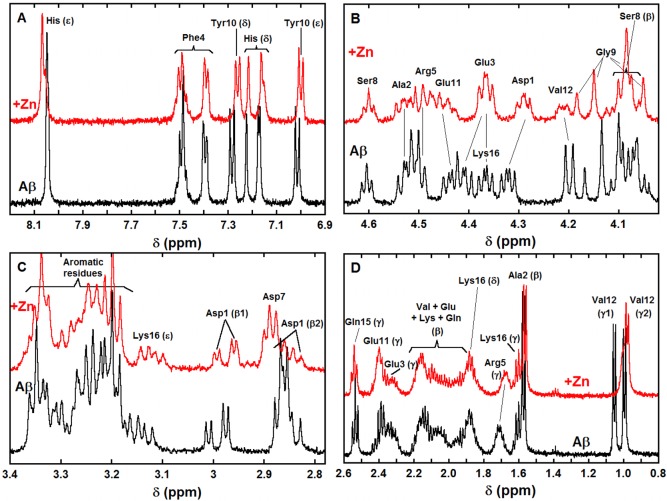
Figure 2.
1H NMR spectra of Aβ (bottom black lines) and of Aβ in the presence of 0.9 equiv of Zn(II) (top red lines) in selected regions (A: aromatic, B: Hα, C: Hβ, D: Hβ and Hγ, unless otherwise specified). [Aβ] = 300 μM, [Zn(II)] = 270 μM in d11-TRIS buffer 50 mM, pH = 7.4, T = 318 K, v = 500 MHz. δ(His6 Hδ) > δ(His14 Hδ) > δ(His13 Hδ). For the details of the amino acid residue nomenclature, see Scheme S1.

