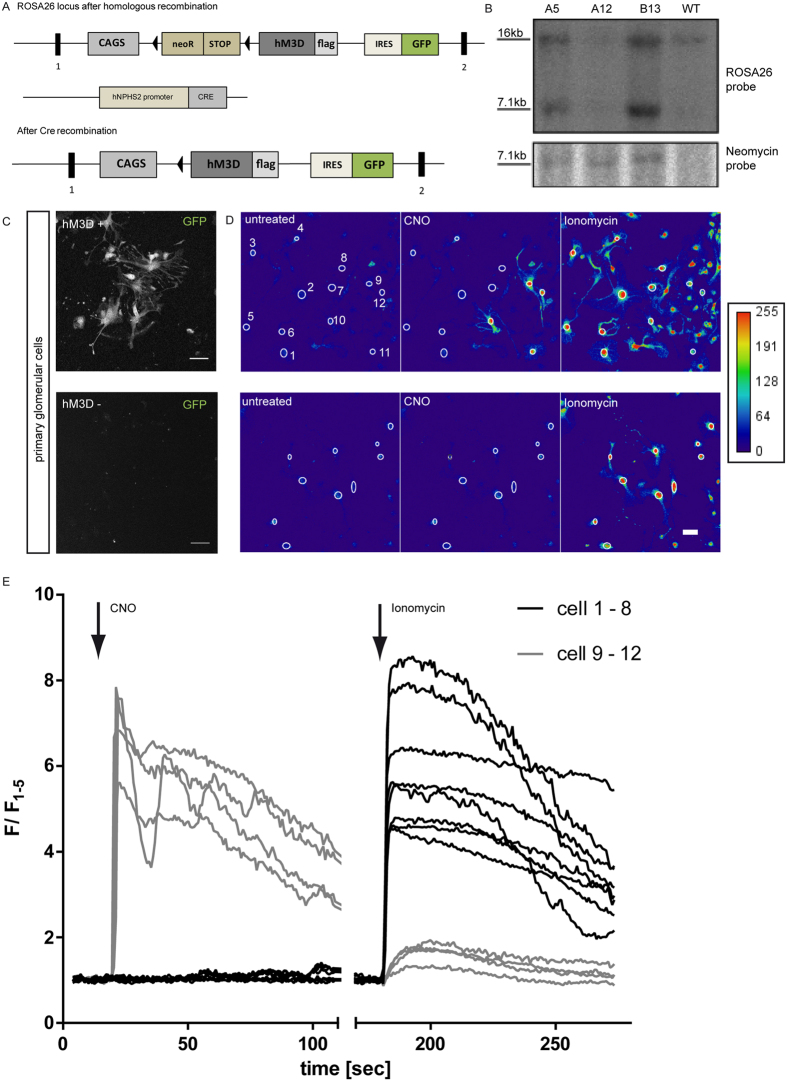
Figure 3. Generation of a transgenic podocyte-specific hM3D mouse model.
(A) Schematic of the ROSA26 locus with the FLAG.hM3D sequence before and after Cre recombination. Triangles indicate loxP sites and rectangles indicate exons. (B) Southern Blot analyses were performed with a ROSA26 and a neomycin probe to screen for positive ES-cell clones. (C) Isolated primary glomerular cells were cultured and GFP expression was visualized by confocal microscopy. Glomerular cells from ROSA26hM3D/wt; PodCretg/wt show cytoplasmic GFP expression. ROSA26wt/wt; PodCretg/wt control cells were GFP negative. (scale bar = 50 μm). (D,E) Representative images of Ca2+ imaging with Fluo-8 (scale bar = 20 μm). Primary glomerular cells were used for Ca2+ imaging with Fluo-8. Cells expressing the receptor showed an instant increase of intracellular Ca2+ levels after administration of 100 μM CNO. Control cells did not react to CNO (scale bar = 20 μm). Experiments were performed in three biological replicates. Fluorescence is depicted as F/F1–5, where the mean value of the first five measurements prior to CNO stimulation was used for normalisation.

