
Figure 2. Posterior probabilities of population membership and genetic discontinuities from the spatial model in GENELAND for the Chilean dolphin using mtDNA and microsatellites markers.
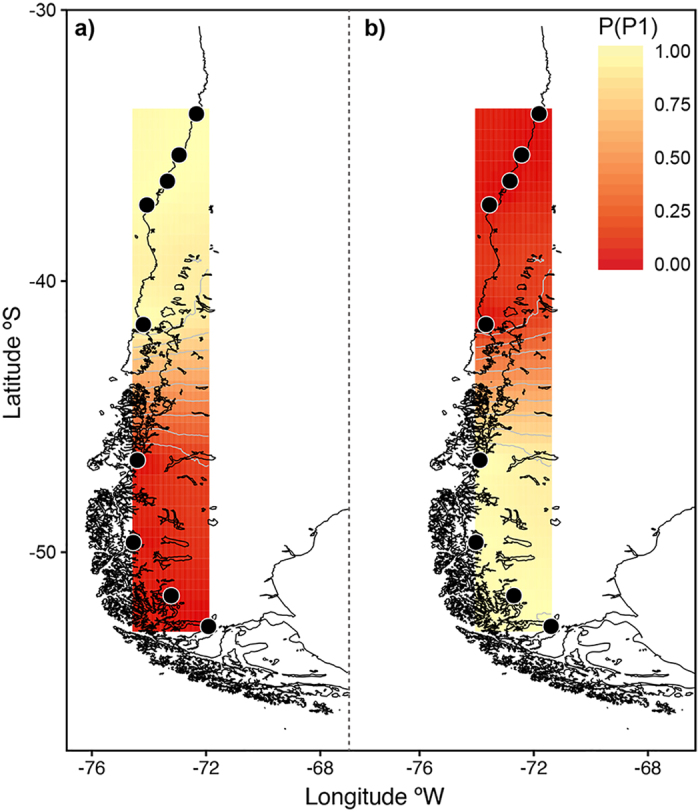
Contour lines indicate the spatial position of genetic discontinuities and lighter colors indicate higher probabilities of population membership. Two genetic clusters were identified. (a) Northern population (b) Southern population. The maps were obtained in GENELAND (http://www2.imm.dtu.dk/~gigu/Geneland/) by the corresponding author and plotted by N. Segovia (Acknowledgments section) in R 3.2.2 software (https://cran.r-project.org/) using ggplot2 (https://cran.r-project.org/web/packages/ggplot2/citation.html). The source of the base maps was GEODAS, NG, NOAA (https://www.ngdc.noaa.gov/mgg/shorelines/) and Coastline Extractor Software was used (https://www.ngdc.noaa.gov/mgg/geodas/geodas.html).