
Figure 4. Bayesian skyline plot for the Northern (a) and Southern (b) populations of the Chilean dolphin.
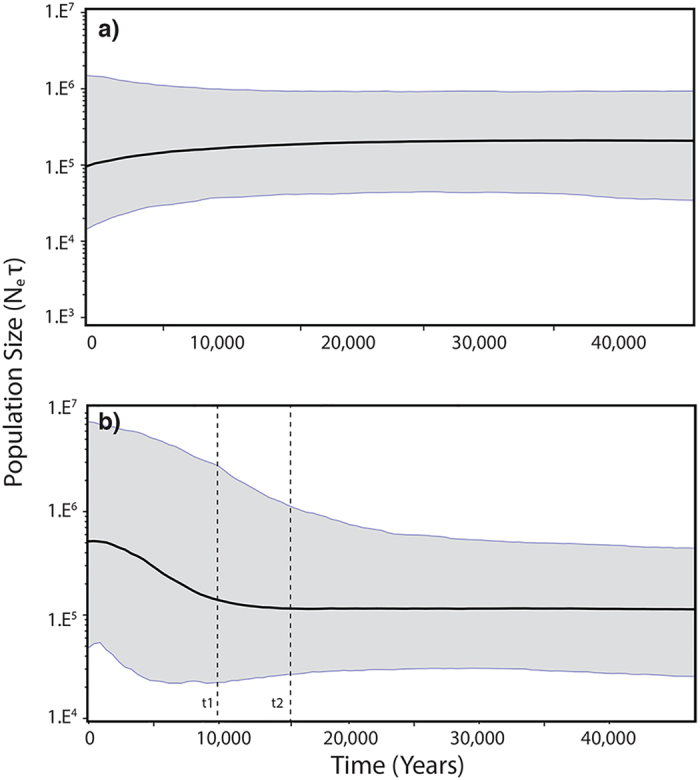
The X axis is in units of years and the Y axis is equal to Neτ; (the product of the effective population size and the generation length in years). The time of population expansion (t1) and start time of deglaciation (t2) were obtained by ABC analysis.