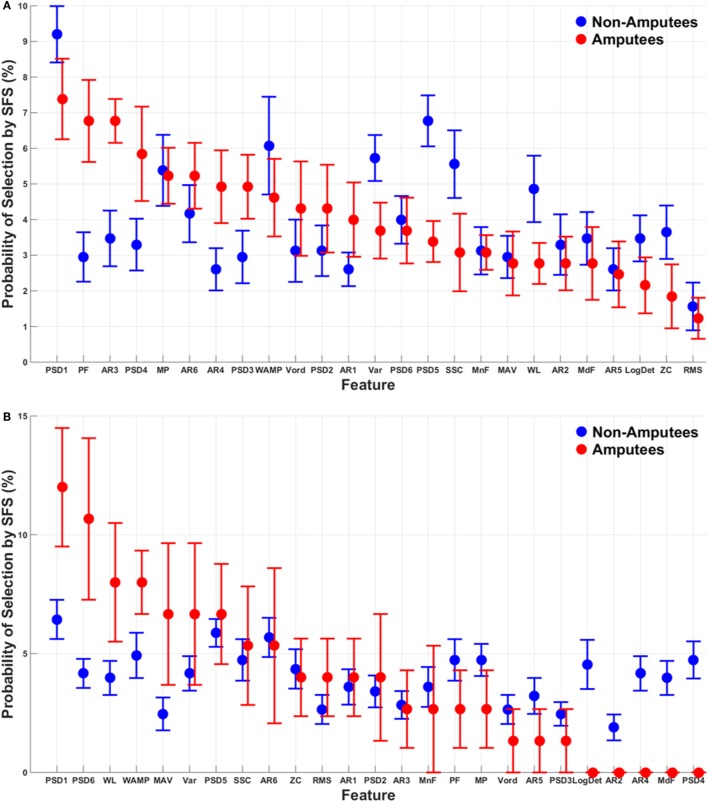
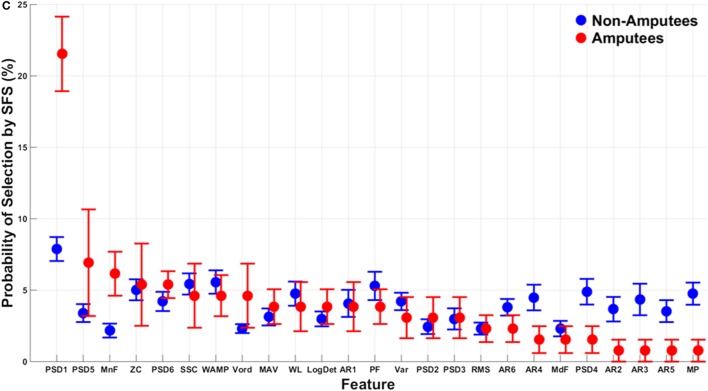
Figure 5.
Probability of selection of the 25 features using the SFS method. Features are ordered from most to least often selected for amputee and non-amputee subjects. Mean absolute value (MAV), zero crossings (ZC), slope-sign changes (SSC), waveform length (WL), Willison amplitude (WAMP), root-mean-square (RMS), variance (VAR), v-order (V-ord, order of 3), log-detector (LogDet), autoregressive (AR1–AR6) coefficients, mean frequency (MnF), median frequency (MdF), peak frequency (PF), mean power (MP), and power spectrum descriptors (PSD1–PSD6). Error bars represent SE. (A) Extrinsics, (B) intrinsics, and (C) extrinsics and intrinsics.


