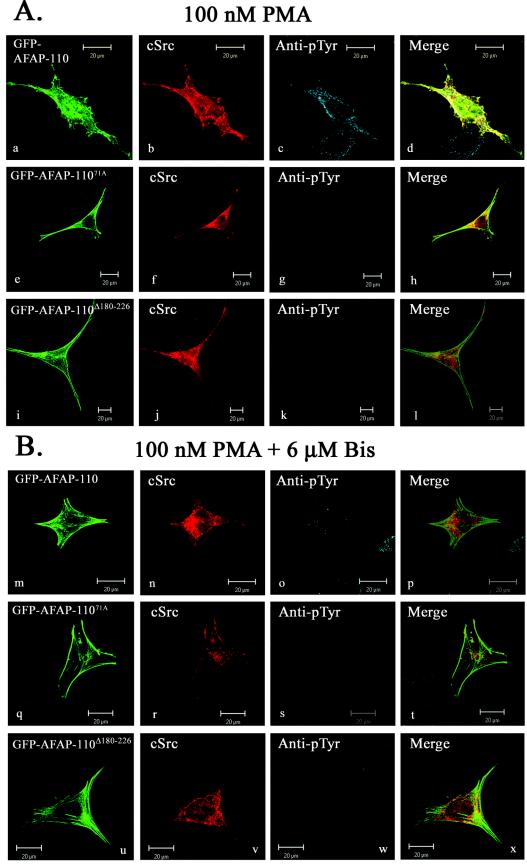
FIG. 7.
PMA directs AFAP-110 to colocalize with c-Src, while PKC inhibitors block PMA-induced colocalization. (A) SYF cells were transiently cotransfected with either GFP-AFAP-110 (a), GFP-AFAP-11071A (e), or GFP-AFAP-110Δ180-226 (i) and c-Src, treated with 100 nM PMA for 30 min, and labeled with MAb EC10 (b, f, and j) and antiphosphotyrosine antibody (c, g, and k). Upon PMA stimulation, SYF cells display a loss of actin stress fiber integrity (a), as well as an increase in immunoreactivity with the antiphosphotyrosine antibody (c). PMA treatment also induced colocalization of GFP-AFAP-110 and c-Src (d). Cells cotransfected with GFP-AFAP-11071A (e) and c-Src displayed immunoreactivity with the antiphosphotyrosine antibody equivalent to that of surrounding nontransfected cells (g) in response to PMA treatment. Cells cotransfected with GFP-AFAP-110Δ180-226 (i) and c-Src displayed immunoreactivity with the phosphotyrosine antibody equivalent to that of surrounding nontransfected cells (k) in response to PMA treatment. (B) SYF cells were cotransfected with either GFP-AFAP-110 (m), GFP-AFP-11071A (q), or GFP-AFAP-110Δ180-226 (u) and c-Src and pretreated with 6 μM bisindolylmaleimide [I] for 6 h and 100 nM PMA for 30 min and then fixed and labeled with EC10 MAb (n, r, and v) and antiphosphotyrosine antibody (o, s, and w). In the presence of bisindolylmaleimide [I], PMA treatment of cells cotransfected with GFP-AFAP-110 and c-Src resulted in no changes in actin filament integrity (m). Likewise, bisindolylmaleimide [I] treatment blocked PMA-induced elevation in cellular tyrosine phosphorylation levels (o) and the colocalization of GFP-AFAP-110 and c-Src (p). In the presence of bisindolylmaleimide [I], PMA treatment of cells cotransfected with GFP-AFAP-11071A and c-Src resulted in no elevation in cellular tyrosine phosphoryation (s). Similar results were observed in cells cotransfected with GFP-AFAP-110Δ180-226 and c-Src (u to x). EC10 was visualized with Cy5 anti-mouse IgG, while antiphosphotyrosine was visualized with TRITC-anti-rabbit IgG.

