
FIG 4 .
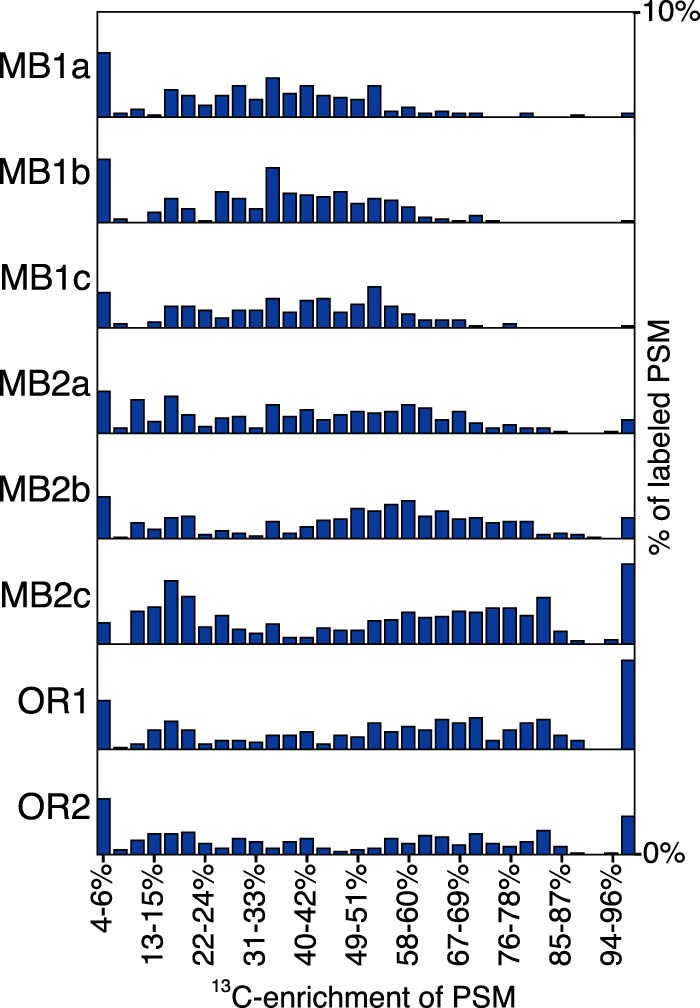
Histogram of highly labeled peptide spectral matches (PSM). The histogram depicts the proportion of labeled spectra (13C enrichment of ≥2%) from 4% to 99% 13C enrichment within 3% enrichment bins. Each distribution depicts bars on a relative scale of 0 to 10% of total labeled spectra. Label frequency and average enrichment values for the samples are presented in Table 1.