
TABLE 2 .
Benchmark summarya
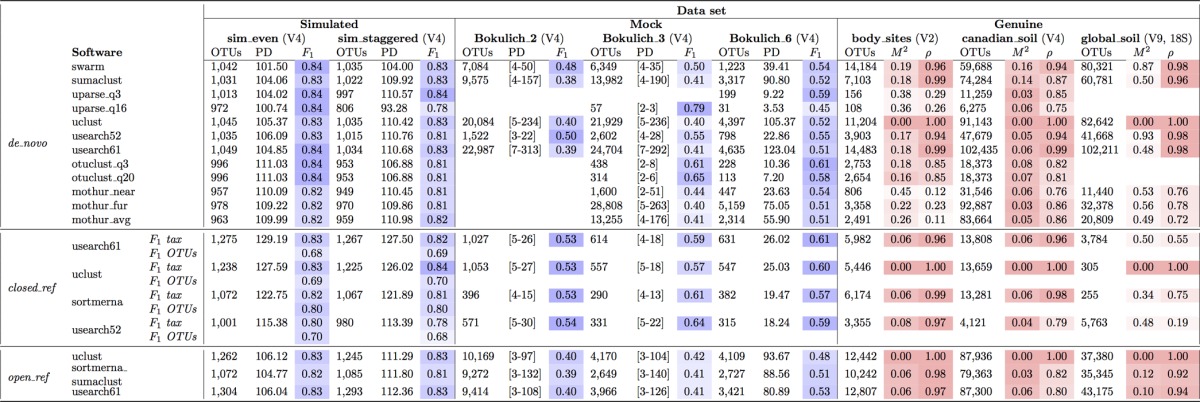
OTU counts do not include singletons. F measure (F1) is for assigned taxonomies at the genus level. The phylogenetic diversity (PD) whole-tree column for Bokulich_2 and Bokulich_3 represent PD intervals across various sampling depths. Procrustes M2 (the sum of the squared deviations or the dissimilarity of two datasets for UniFrac PCoA) and rho (Pearson’s correlation coefficient for taxonomies at genus level) values are with respect to UCLUST (default for QIIME versions 1.0.0 to 1.9.1). Monte Carlo P values were not included, since all values were <0.05 except for de novo usearch52 versus uclust (P = 0.09). The darkest blue shades represent the highest F1 scores, while the darkest red shades represent results closest to those obtained with UCLUST.