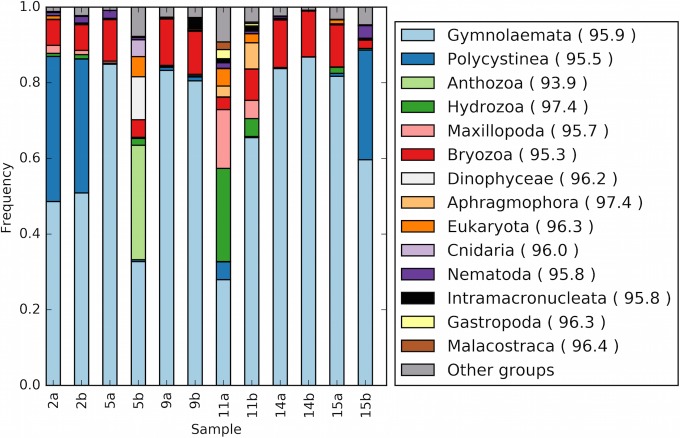
FIG 6 .
Bar chart displaying the abundance of eukaryotic classes within reads mapping to SSU rRNA genes. Reads were assigned to the LCA of top hits to the SILVA database. Clade abundances in each sample are relative to the total number of reads per sample mapping to a eukaryotic SSU rRNA gene. Clades with abundances of >1% in at least one sample are shown. The average percent identities of sample reads to their top hit within each taxonomic group are displayed in parentheses.

