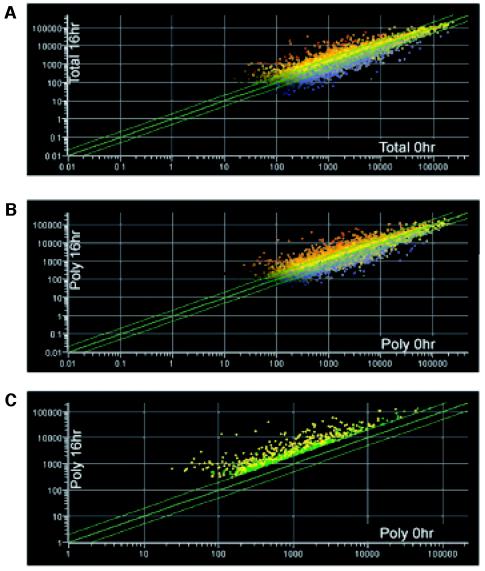
FIG. 2.
Scatter plots of oligonucleotide probes as affected by hypoxic stress. Total and polysomal RNAs were hybridized to the Affymetrix Human Genome U95A (HG-U9Av2) oligonucleotide microarray chip. Relative gene probe intensities (x axis) of total RNA (A) and polysomal mRNA (B and C) of aerobic cells (0 h) were plotted against the corresponding gene probe intensities (y axis) of hypoxia-treated cells (16 h). Gene probes above the top green line represent genes induced >2-fold; gene probes below the bottom green line represent genes repressed >2-fold. (C) Gene probes in green represent genes that were induced >2-fold in the polysomes but whose total mRNA was not induced >2-fold. A short list of these translational candidates is presented in Table 2. Gene probes in yellow represent genes whose expression was induced >2-fold in both the total RNA and polysomal mRNA profiles.

