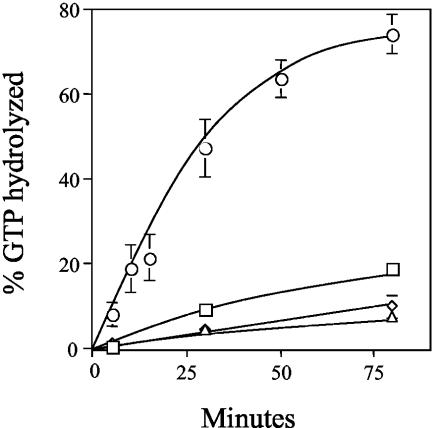
FIG. 3.
eRF3 GTPase assays. GTPase assays were carried out with various combinations of purified eRF3-ΔNM, eRF1, and salt-washed ribosomes. The graph indicates the GTP hydrolysis associated with 3 pmol each of eRF3-ΔNM and eRF1 (triangles), eRF3-ΔNM and ribosomes (squares), eRF1 and ribosomes (diamonds), and eRF3-ΔNM, eRF1, and ribosomes (circles).

