Fig. 3.

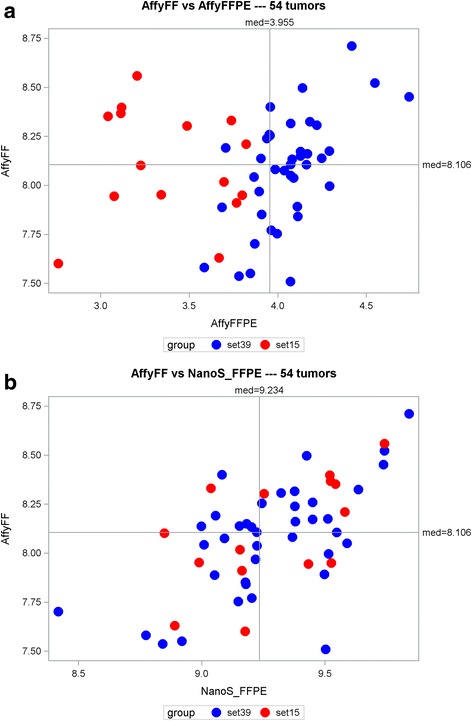
Scatterplots of the Affymetrix FF vs. Affymetrix FFPE (a) and NanoString FFPE (b) mean scores for the 54 samples. The red circles represent the 15 samples with “poor” RNA quality

Scatterplots of the Affymetrix FF vs. Affymetrix FFPE (a) and NanoString FFPE (b) mean scores for the 54 samples. The red circles represent the 15 samples with “poor” RNA quality