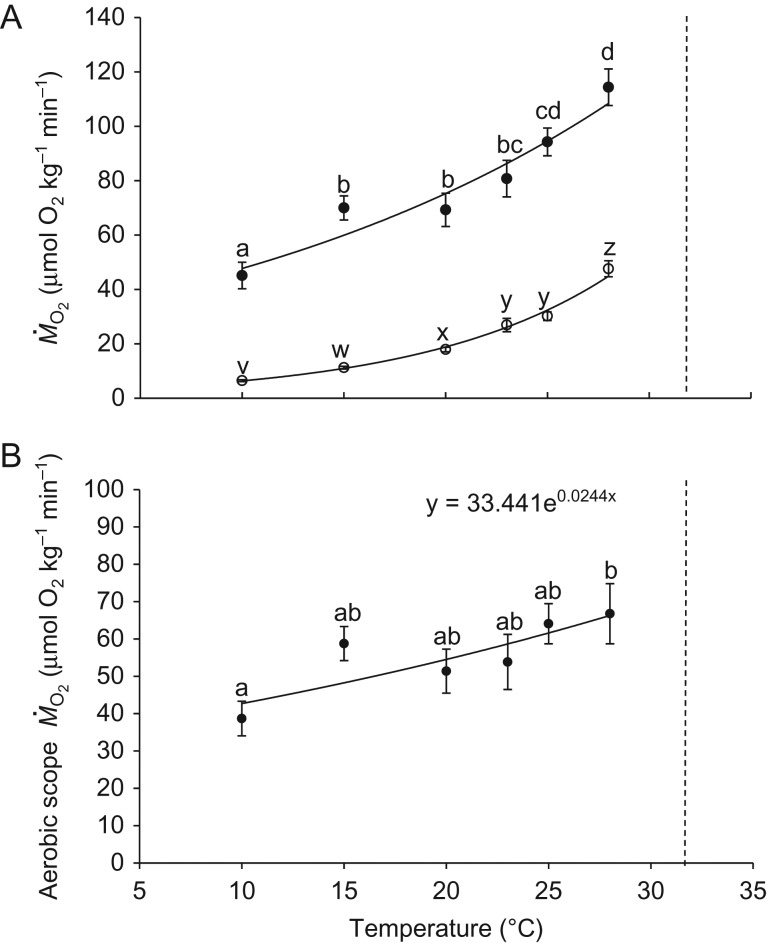
Figure 2:
(A) Standard metabolic rate (SMR; open circles) and maximal metabolic rate (MMR; filled circles) at different temperatures for eels acclimated to 18°C. The SMR and MMR increased with temperature over the temperature range tested here. The increases in SMR and MMR fitted exponential lines reasonably well (R2 = 0.99 and R2 = 0.92, respectively). Different letters indicate significant differences between temperatures. Data are means ± SEM; n = 6–9. (B) Aerobic scope with increasing temperatures. The dashed line represents the critical thermal maximum (CTmax). Different letters indicate significant differences between temperatures. Data are means ± SEM; n = 6–9.

