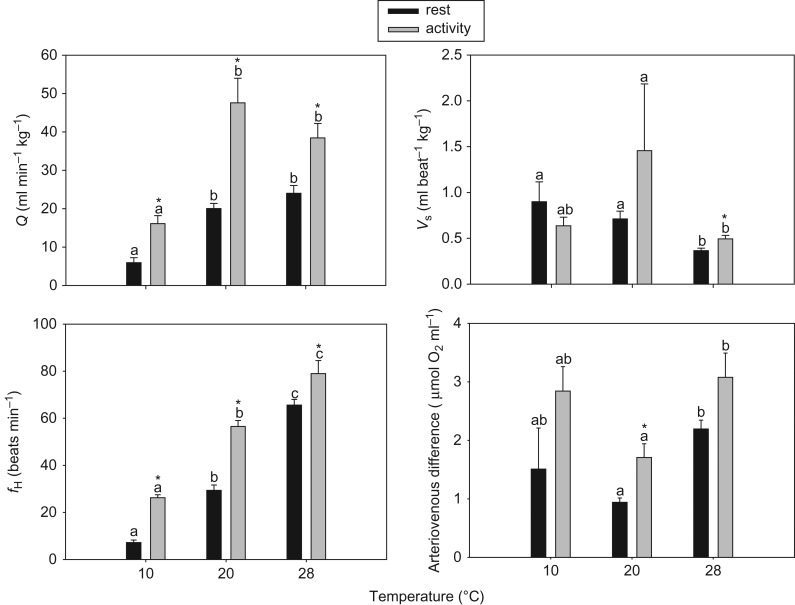
Figure 4:
Cardiac output (), heart rate (fH), stroke volume (Vs) and arteriovenous oxygen concentration difference at different temperatures during rest and activity. *Values are significantly different from each other within temperature groups. Different letters indicate that values for the different temperatures and same treatment (rest or activity) are significantly different from each other. Data are means ± SEM; n = 6–8.

