Fig. 4.

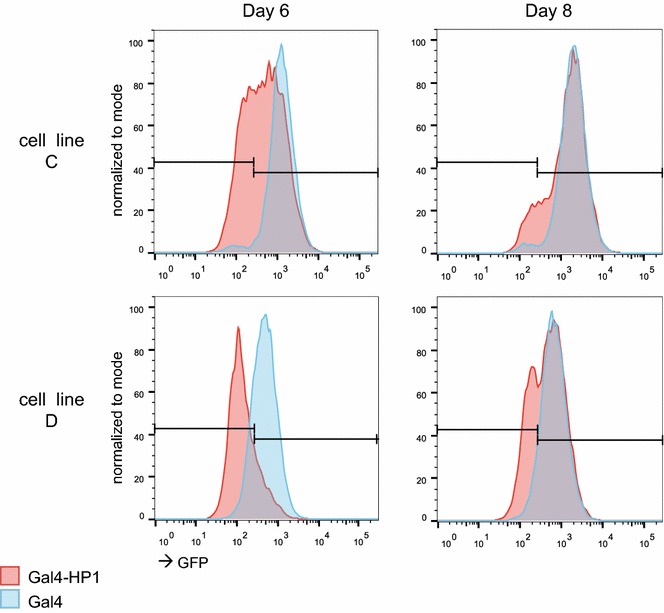
Variegation upon HP1 targeting. GFP expression distributions in two single-integration cell lines upon Gal4-HP1 targeting (red) compared to Gal4 only (blue) as quantified via FACS by 6 and 8 days after transient transfection

Variegation upon HP1 targeting. GFP expression distributions in two single-integration cell lines upon Gal4-HP1 targeting (red) compared to Gal4 only (blue) as quantified via FACS by 6 and 8 days after transient transfection