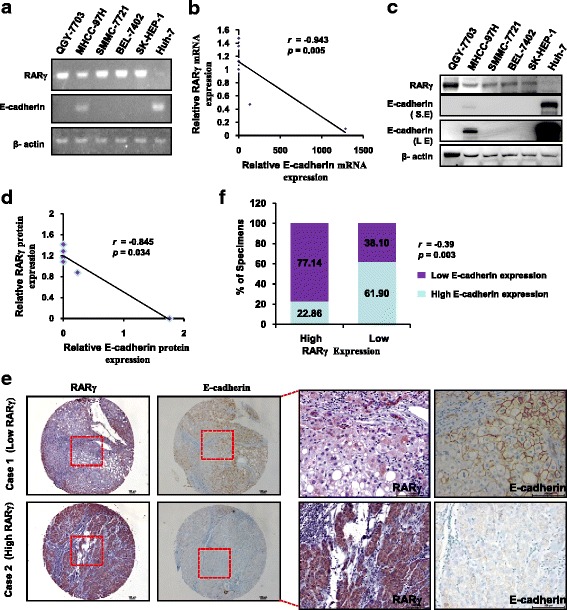
Fig. 5.

The expression levels of RARγ and E-cadherin in HCC cell lines and clinical HCC tissues. a The expression of RARγ and E-cadherin were evaluated by RT-PCR in the indicated cell lines. b Dot plot correlates the mRNA levels of RARγ and E-cadherin in HCC cell lines. The dotted line shows the negative correlation of RARγ and E-cadherin at the mRNA levels. c Immunoblotting analysis of RARγ and E-cadherin expression in the indicated cell lines. d The dot plot correlates RARγ and E-cadherin protein levels in six HCC cell lines. The dotted line shows the negative corralation of RARγ and E-cadherin at the protein levels. e Immunohistochemical staining of RARγ and E-cadherin in human CRC tissues. Representative bright-field images showing RARγ and E-cadherin staining in human HCC sections. Scale bar: 100 μm. f Spearman’s correlation analysis between RARγ and E-cadherin in 56 cases of HCC tissues
