Fig. 1.

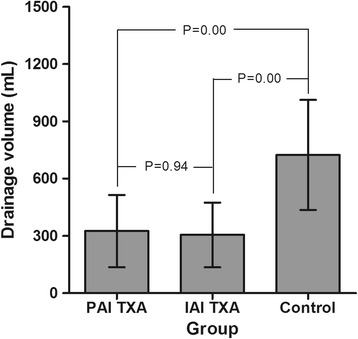
The postoperative drainage volume of the three groups. Legend: The volume was significantly lower for patients in the PAI-TXA and IAI-TXA groups compared to the control group (P < 0.05) and was comparable for the two TXA groups (P = 0.94)

The postoperative drainage volume of the three groups. Legend: The volume was significantly lower for patients in the PAI-TXA and IAI-TXA groups compared to the control group (P < 0.05) and was comparable for the two TXA groups (P = 0.94)