
Fig. 4.
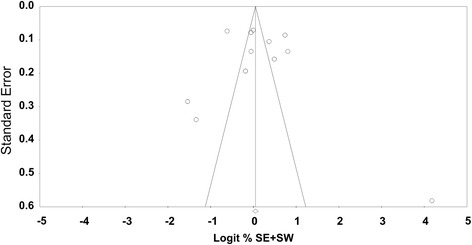
Funnel plot. Standard errors are plotted against the logarithm of the share of dentists performing selective (SE) or stepwise (SW) carious tissue removal. No significant asymmetry was identified
Official websites use .gov
A
.gov website belongs to an official
government organization in the United States.
Secure .gov websites use HTTPS
A lock (
) or https:// means you've safely
connected to the .gov website. Share sensitive
information only on official, secure websites.
Funnel plot. Standard errors are plotted against the logarithm of the share of dentists performing selective (SE) or stepwise (SW) carious tissue removal. No significant asymmetry was identified