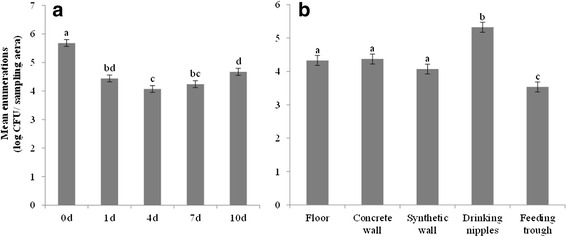
Fig. 1.

Mean enumeration of total aerobic flora with standard errors. Mean enumerations are given for each sampling moment (a) and location after disinfection (b). Samples (n = 135) were taken before disinfection (0d) and 1 day (1d), 4 days (4d), 7 days (7d) and 10 days (10d) after disinfection. Samples (n = 108) were taken from each location. Significant differences between sampling moments/ locations are indicated by different letters above bars
