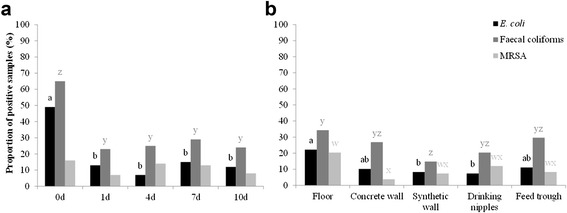
Fig. 2.

Proportion of positive samples given for detection of E. coli, faecal coliforms and MRSA, respectively. Proportions are given for each sampling moment (a) and location after disinfection (b), in percentage. Samples (n = 135) were taken before disinfection (0d) and 1 day (1d), 4 days (4d), 7 days (7d) and 10 days (10d) after disinfection. Samples (n = 108) were taken from each location. Significant differences between sampling moments/ locations per bacteriological parameter are indicated by different letters above bars
