Fig. 4.

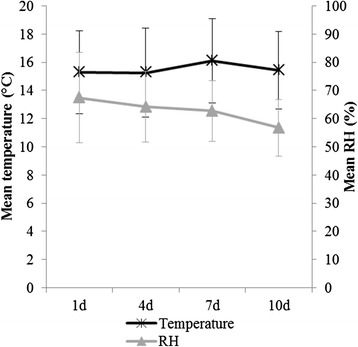
Mean temperature (°C) and relative humidity (RH, %) with standard deviations given per sampling moment. Sampling moments: day 1 (1d), 4 (4d), 7 (7d), 10 (10d) after disinfection

Mean temperature (°C) and relative humidity (RH, %) with standard deviations given per sampling moment. Sampling moments: day 1 (1d), 4 (4d), 7 (7d), 10 (10d) after disinfection