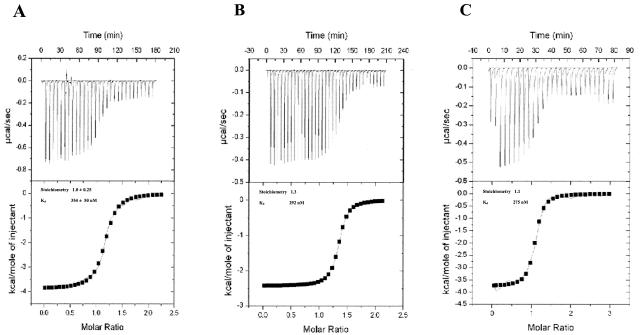
FIG. 4.
ITC analysis of LdPEX5-PTS1 interaction. (A) 60 μM LdPEX5, (B) 60 μM ldpex5 Δ269-291, and (C) 26 μM His6-CT-ldpex5 in degassed 20 mM sodium phosphate (pH 7.5)-120 mM NaCl-3 mM β-mercaptoethanol were titrated at a constant temperature of 30°C against a 1 mM solution of AKL peptide delivered at 6-min intervals from a syringe. The top panel for each LdPEX5 protein represents the thermogram showing the amount of heat released (in microcalories per second) after each injection. The bottom panel is the corresponding plot for the heat of reaction per injection (in kilocalories per mole of peptide) as a function of the [peptide]/[LdPEX5] ratio. The binding association constant Ka (Kd = 1/Ka), the stoichiometry (n), and the enthalpy (ΔH0) were determined after fitting the data by using the model for a one type of binding site.

