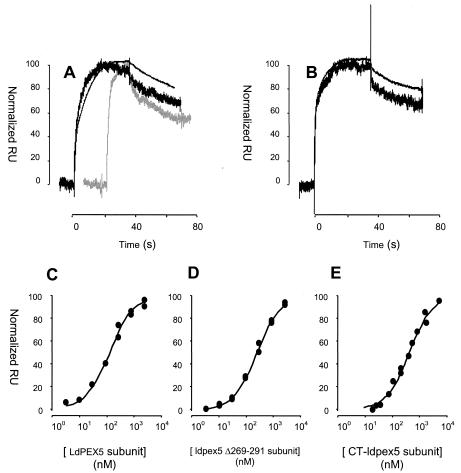
FIG. 6.
Analysis of LdPEX5-AKL PTS1 peptide interaction by SPR. (A) Control-corrected and normalized sensorgrams corresponding to the injection of 300 nM LdPEX5 (black) or His6-CT-ldpex5 (gray) over the 10-RU AKL surface (thick curves) and the 100-RU AKL surface (thin curve). (B) Control-corrected and normalized sensorgrams corresponding to the injection of 300 nM ldpex5 Δ269-291 over the 10-RU AKL surface (thick curve) and the 100-RU AKL surface (thin curve). (C to E) Control-corrected and normalized plateau RUs (RU at the equilibrium plateau) obtained when various concentrations of LdPEX5 (C), ldpex5 Δ269-291 (D), or His6-CT-ldpex5 (E) solutions were injected over the two different density AKL peptide surfaces. The solid lines correspond to the fit when the data generated on both surfaces are globally analyzed with a simple model.

