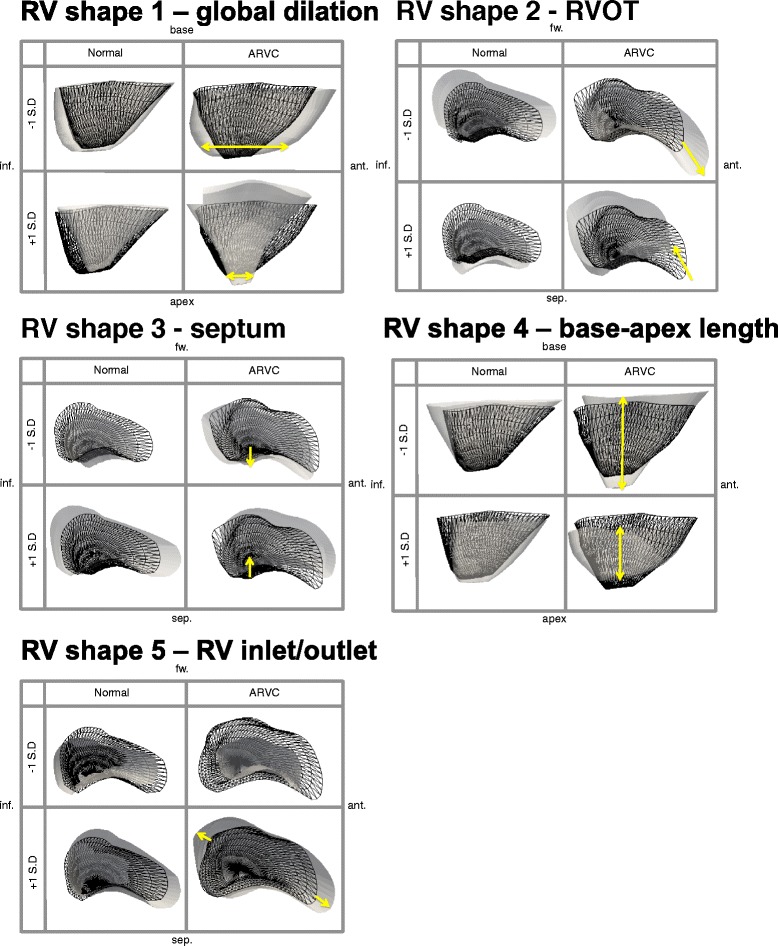
Fig. 3.

The first five RV shapes, in descending order from most prominent in the population to least prominent, for the control group (left) and the ARVC group (right) shown at ±1 standard deviation (SD) at the ES phase. In each box, the mean for the group (control or ARVC) is shown as reference in black wireframe, and the shape at each extreme (±1 SD) is shown in solid white. The yellow arrows indicate the location and direction of greatest shape variance in the ARVC shapes, which showed global dilation/shrinking for shape 1, elongation/shortening at the RV outflow tract for shape 2, titling (leaning) from apex to base at the septum for shape 3, lengthening/shortening for shape 4 and bulging/shortening at both the RV inlet and RV outlet for shape 5. These shapes are consistent with known shape abnormalities in these patients. Note that the sign (+/-) is not indicative of positive/negative change in PCA and is thus arbitrarily assigned. Abbreviations: inf: inferior, sep: septal, ant: anterior, fw: RV free wall
