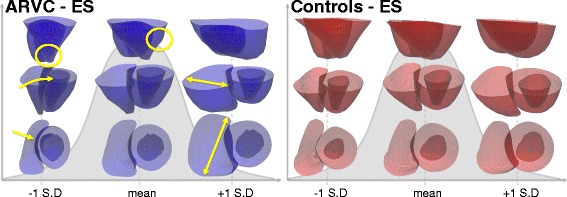
Fig. 4.

The mean and first PCA shape (shown at ±1SD) for the ARVC group (left) and the control group (right) at the end systolic (ES) frame. The first shapes capture the size variance in each population, since no size correction was performed prior to analysis. The yellow arrows at -1SD highlight the narrow RV that is tilted towards the LV, the yellow circle at -1SD highlights the narrow apex, the yellow circle at the mean shows a bulge in the RV, and the yellow double sided arrows at +1SD highlight the dilation of the RV. Note that the top row is showing the RV in front of the LV
