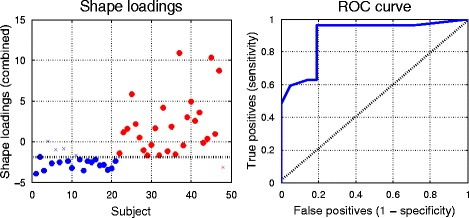
Fig. 7.

Left: The sum of the shape loadings (after normalisation and scaling) for all subjects with controls shown in blue, ARVC shown in red. Crosses denote misclassified subjects (i.e. controls misclassified as ARVC, ARVC misclassified as controls) from the classifier trained on the sum of the loadings using a leave-one-out protocol. Note that the misclassified ARVC patient was a patient with a borderline diagnosis of ARVC. The line that divides the predicted groups is shown in black. Right: The ROC curve from the classification (blue line) and predictive accuracy that would result from random guess (dashed diagonal black line)
