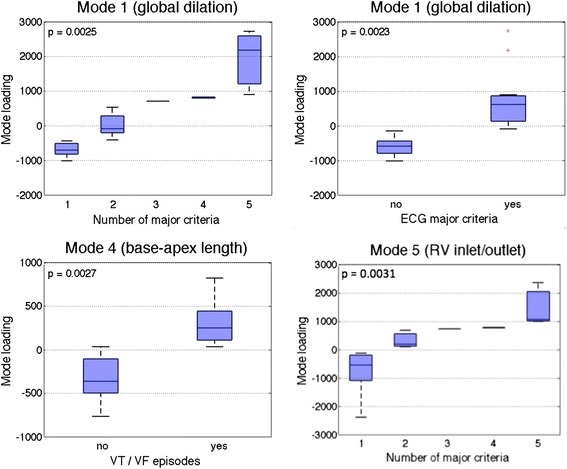
Fig. 9.

Loadings of bi-ventricle shape 1 plotted against the number of major TFC criteria (top left), ECG major criteria (top right), bi-ventricle shape 4 plotted against history of arrhythmias (bottom left), and bi-ventricle shape 5 plotted against the number of major TFC criteria (bottom right). The loadings represent how present the shape is in each patient. Note that shape 1 represented global dilation of the RV, shape 4 represented base-apex length of the RV, and shape 5 represented bulging at the inlet and outlet of the RV (see Fig. 5)
