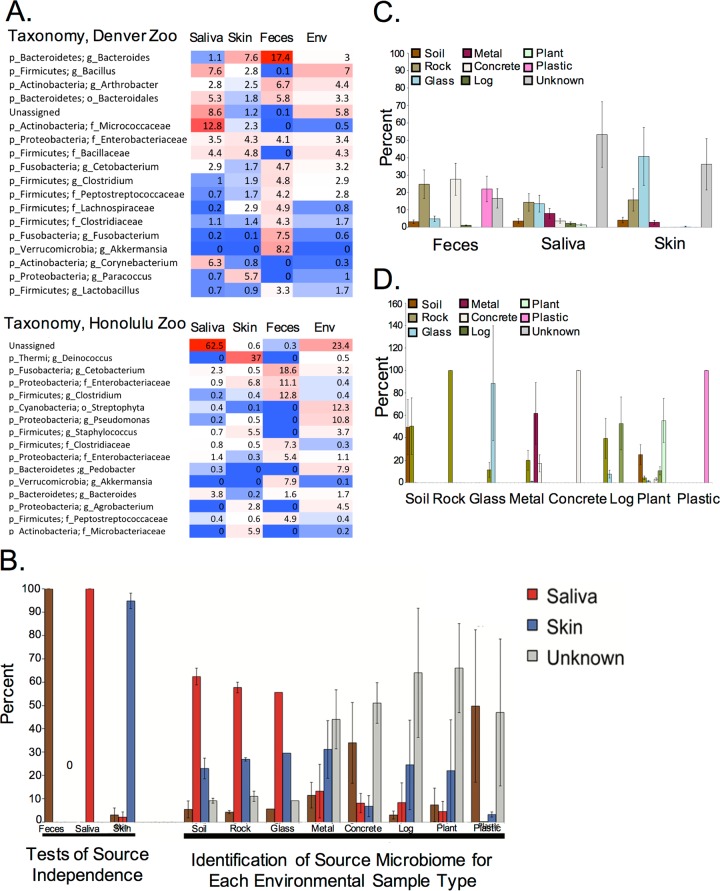
FIG 2 .
(A) Heat maps illustrate the percent abundances of the most abundant genera (all OTUs taxonomically classified to the same genus were collapsed into a single genus summary) present in saliva, skin, feces, and environmental (Env) samples collected from the Denver and Honolulu zoos. The deepest taxonomic classification achieved is listed for each genus. The heat map colors indicate percent abundance (red [high abundance] to blue [low abundance]). (B) Komodo dragon SourceTracker analysis reveals that the microbial communities of many environmental sample types are sourced from skin, saliva, and feces rather than unknown sources (i.e., not from Komodo dragon skin, saliva, or feces). Data are plotted as the means ± standard errors of the means (error bars) of samples from Denver and Honolulu zoo Komodo dragons. (C) SourceTracker analyses with Komodo dragon fecal, salivary, and skin samples designated as sinks and environmental samples designated as sources reveals that a variety of environmental sources, rather than a single environmental source, contribute to the microbial communities of Komodo dragon feces, saliva, and skin. Unknown sources (i.e., not the environments sampled from the Komodo dragon enclosures) also contribute about 40% or more of the microbial community of saliva and skin samples (only 20% of fecal samples). (D) Independence tests reveal that about half of the environmental samples are not independent from other environmental samples. Data are the means ± standard errors of the means of Denver and Honolulu Komodo dragon and environmental samples.

