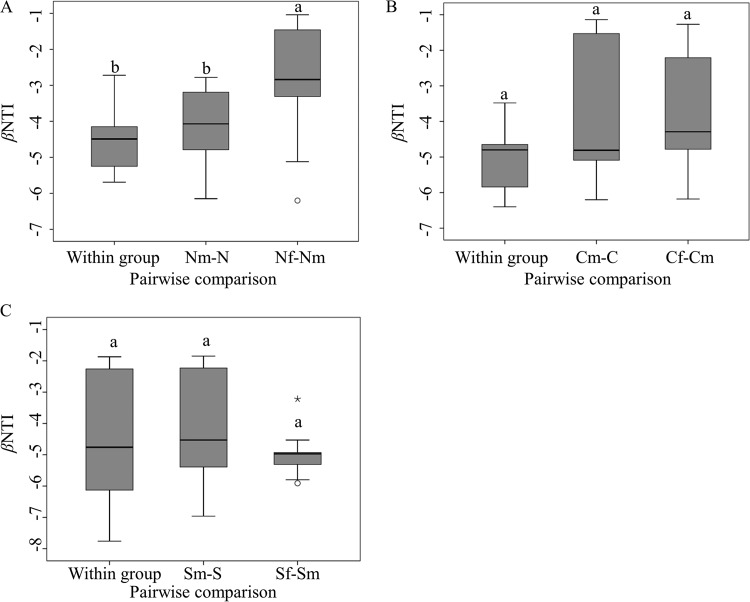
FIG 1 .
Boxplots of βNTI distribution in the Mollisol (A), Inceptisol (B), and Ultisol (C) soil types. Each boxplot shows the median value (thick black line), first quartile (bottom of the box), third quartile (top of the box), and range of the data that were no more than 1.5 times height of the boxes (error bars). Moderate outliers (circles) and extreme outlier (asterisk) are also shown. Significance was determined by one-way ANOVA followed by the LSD test. Boxes with the same letter were not statistically significantly different (P > 0.05). Boxes of within groups represent pairwise comparisons between any two samples within a treatment. Boxes for Nm-N, Cm-C, and Sm-S represent pairwise comparisons between maize cropping samples (m suffix) and bare fallow samples (no suffix) for samples from sites N, C, and S. Boxes of Nf-Nm, Cf-Cm, and Sf-Sm represent pairwise comparisons between NPK fertilization samples (f suffix) and maize cropping samples (m suffix) from the three sites.

